Polarization Analysis with SFEM
The scattering of electrons in solids is dominated by the Coulomb interaction, but electrons have a spin and this degree of freedom affects the scattering processes via two fundamental spin-dependent interactions: the spin-orbit coupling and the exchange interaction. Theoretical and experimental work - specifically performed in a situation where electrons scatter at surfaces - have provided a clear understanding of the fundamental principles of spin dependent scattering. Nowadays, spin dependent electron scattering has found important applications in spintronics.
Scanning Electron Microscopy with Polarization Analysis (SEMPA)
Electron scattering at surfaces involving spin-polarized beams or the detection of spin polarization of scattered electrons was used in the past for various purposes, including imaging of the surface magnetic contrast with sub-micrometer spatial resolution. An example of this application is a technology called SEMPA (Scanning Electron Microscopy with Polarization Analysis), which is used in our group for research into small-scale magnetism. In SEMPA, a focused primary electron beam - typically with a few keV kinetic energy and originating within a conventional electron gun column - is directed toward a magnetic target.
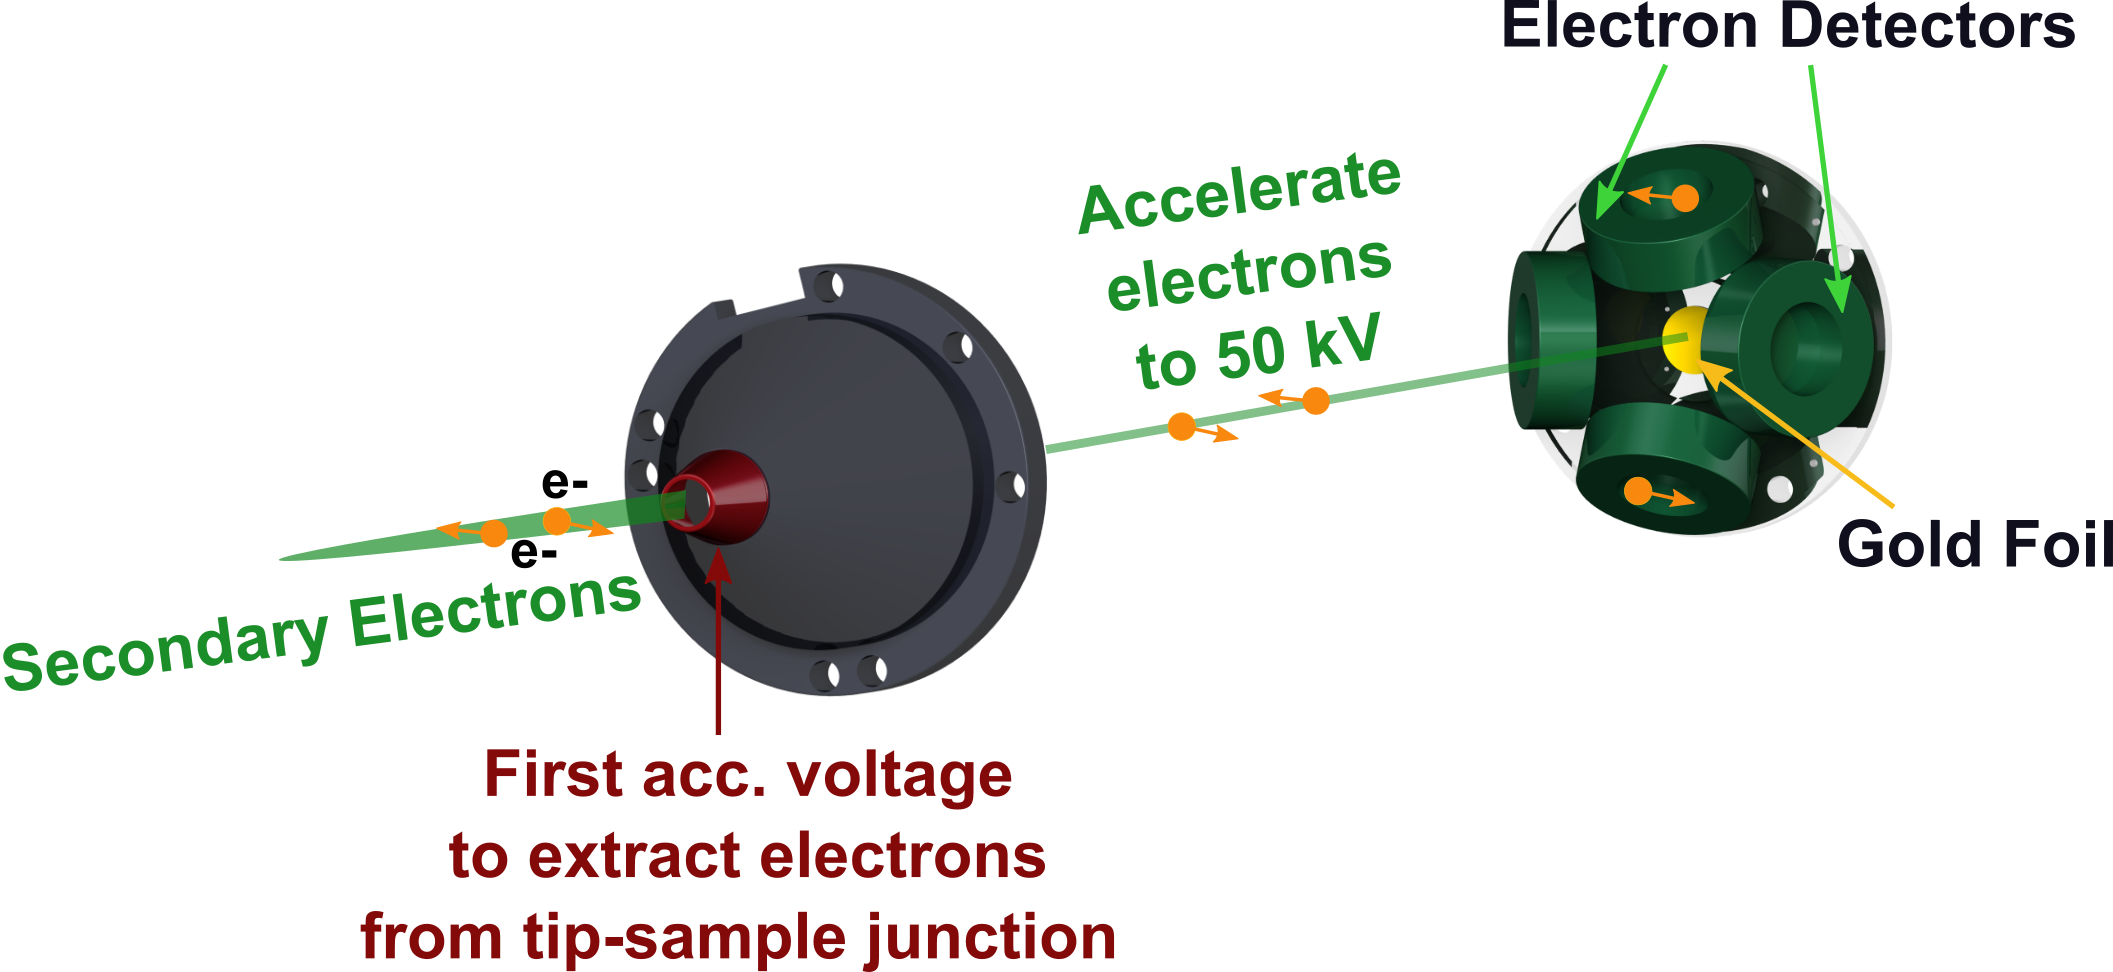
The low energy secondary electrons (around 6 eV kinetic energy) excited by the primary beam acquire a spin polarization, which is used to detect the local magnetization vector of the target area residing within the primary beam focus. These secondary electrons are extracted out of the tip-sample region by a Mott-Detector (Figure 7) with an acceleration voltage. In the Mott Detector the electron beam is focused with a voltage up to 50 kV. In the core of the Mott-Detector the electrons hit a gold foil (yellow in Figure 7) and are deflected in one of the four detectors (green in Figure 7) according to their spin.
SFEMPA
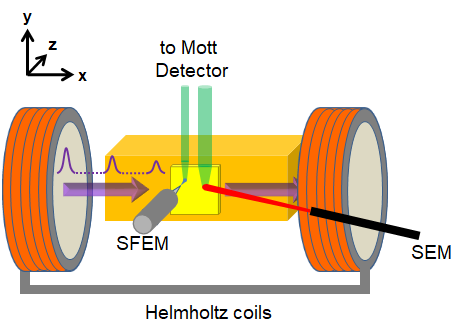
Whereas in SEMPA the primary electron beam is produced by a meter-sized electron gun column (Figure 6, black), in our novel technology called SFEMPA (Scanning Field-Emission Microscopy with Polarization Analysis) we replaced the electron source with a nanometer-sized tip (Figure 6, grey), thus merging two apparently very distant technologies: STM and SEMPA.
In Figure 7, magnetic imaging obtained by means of SEMPA (panels a) to d) is compared to SFEMPA measurements (panels e) and f) of the same sample area entailing a cross-shaped microstructure. This structure consists of a 47-atomic-layers-thick Fe-film grown by Molecular Beam Epitaxy onto a W(110)-single crystal surface.
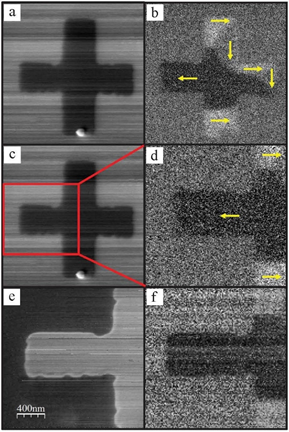
All panels in the left column (a), c), e)) show the total electron yield registered at the spin detector providing an image of the topographic contrast between the Fe-cross and the tungsten surface underneath.
The magnetic contrast of the same sample region is shown in the right column of Figure 7 (b), d), e).
In the experiments shown in panels a), b), c), and d) the surface was bombarded by primary electrons generated in the SEM, while in panel e) and f) the primary beam was coming from the tip in the SFEM. Note that Figure 7 d) and f) display the very same area on the sample.
The local component of the spin polarization vector along the horizontal axis is encoded with a gray scale, going from darker (spin polarization along the negative horizontal axis) to brighter (spin polarization along the positive horizontal axis).
The direction of the magnetic domains is indicated by the yellow arrows. Mostly prominent is the dark-bright contrast arising from domains magnetized in opposite horizontal directions.
The very same dark-bright contrast seen in the SEMPA image in Figure 7 d) can be recognized also in the SFEM image Figure 7 f), which is the first observation of magnetic domains measured employing the technology originating from the topografiner! For more details about this measurement please refer to external pageU. Ramsperger, 'Vectorial non-destructive magnetic imaging with scanning tunneling microscopy in the field emission regime'.
We constructed a low temperature version of the instrument.